Improving our Visualization
Now let's add some more involved visualization to our simulation. Visualizations allow users of your simulation to better understand your model, and includes generating graphs in the Plots view, and improving the visuals in the 3D Viewer.
PlotsCopy link to this section
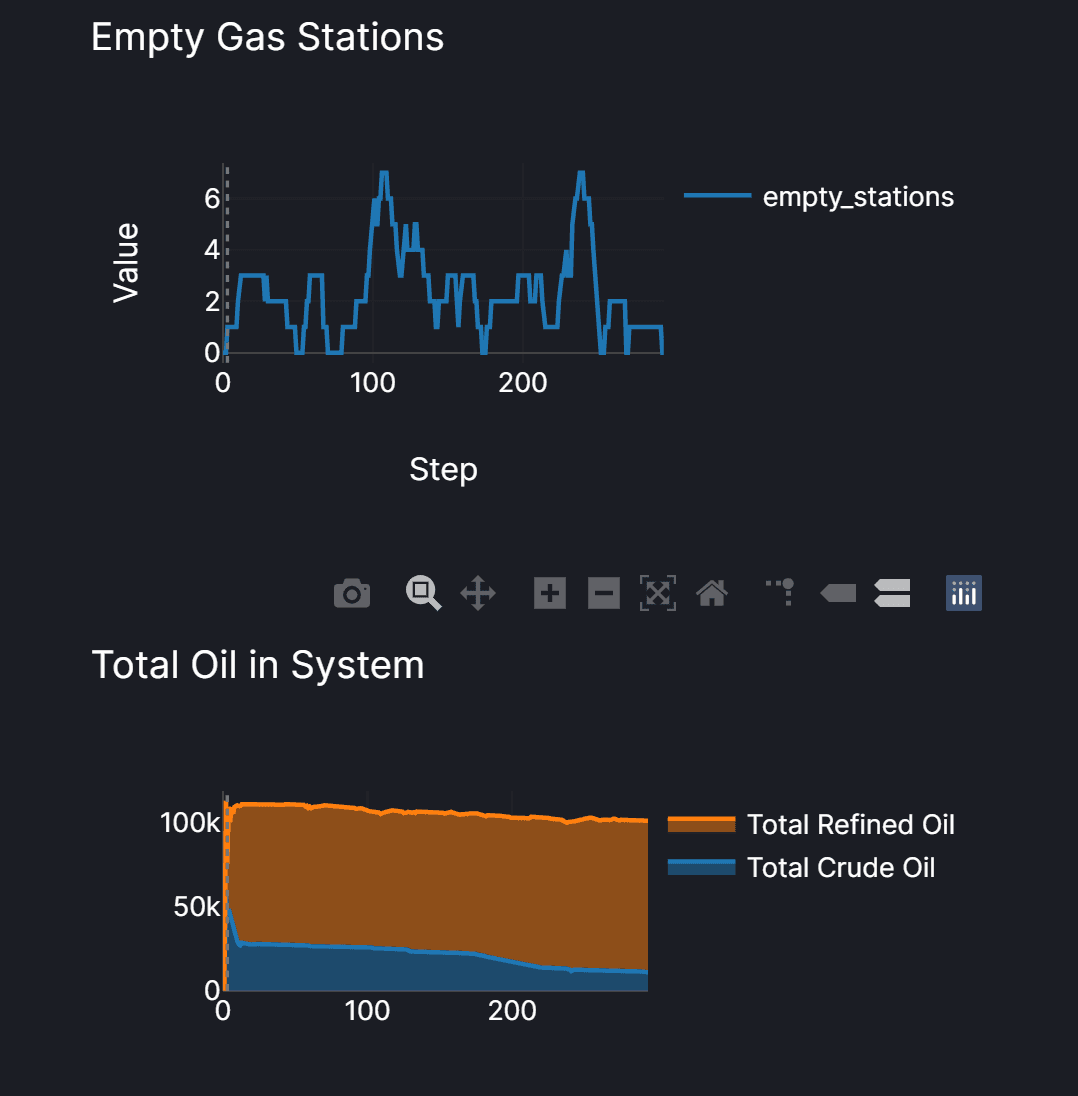
We'll start by defining outputs that track metrics of interest, like the total quantity of crude and refined oil, and the number of gas stations that are empty. We'll use those outputs to generate a few plots of interest.
analysis.json

"empty_stations": [
  {
    "op": "filter",
    "field": "ordered",
    "comparison": "eq",
    "value": true
  },
  {
    "op": "count"
  }
]
Advanced Agent VisualizationsCopy link to this section
Visualizing StocksCopy link to this section
Let's make it easier to tell how much stock our agents are holding. We'll link the height of the agents to their level of stock, and adjust their scale to improve visibility. We'll have to add these lines of code in different behaviors for each agent, and adjust the specific field names we're accessing.
state.set("height", state.get("crude") / 500);Adding Poly ModelsCopy link to this section
HASH has built in poly models which allow you to more accurately represent many different types of agents. We'll create a dummy agent next to each one we edited in the previous section, and edit the actual Tanker and Truck agents with a shape and a scale to size them properly.
| Agent | Shape |
|---|---|
| Tanker | "boat" |
| Port | "cube'" |
| Refinery | "factory" |
| Storage | "silo" |
| Distributor | "silo" |
| Retailer | "store" |
| Truck | "car" |
Adding EdgesCopy link to this section
We'll also add edges to help visualize the flows between different agents. Take a look at the docs section on visualizing networks for implementation details.
Agents in MotionCopy link to this section
Both out truck agents and our tankers could look more realistic as they move along their routes. We'll add some logic to ensure that they are facing in the direction they are moving. The code that can help us with that is simply takes the vector difference between the current and next lng_lat position:
state.set(
  "direction",
  new_lng_lat.map((c, i) => state.get("lng_lat")[i] - c),
);